
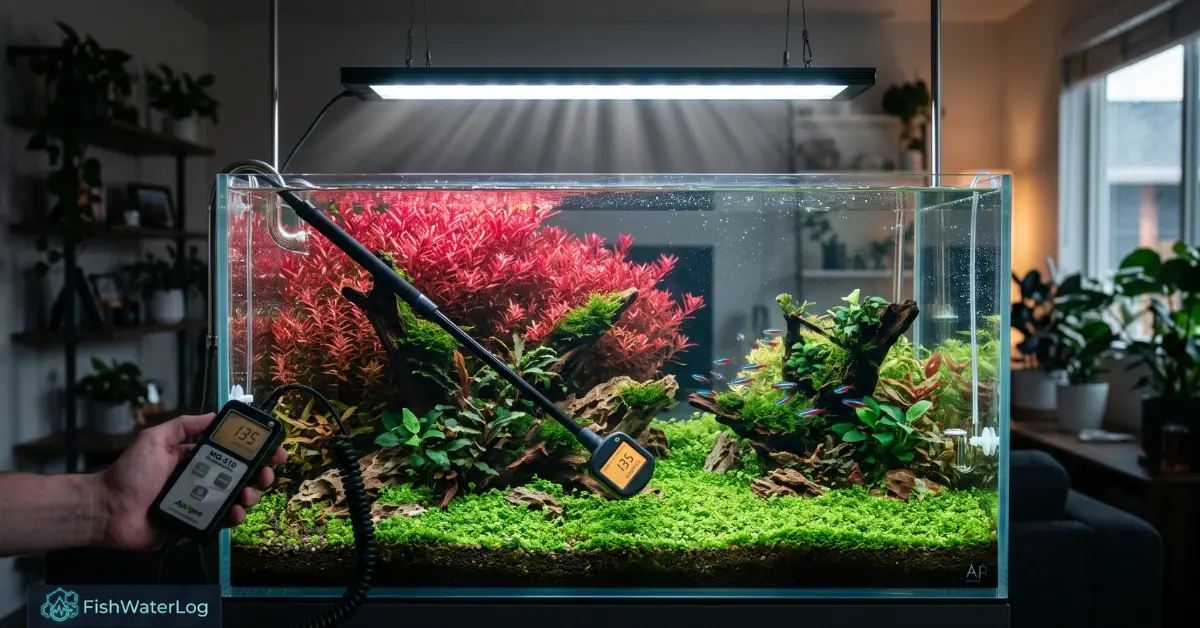
The precise management of radiant energy in closed aquatic ecosystems dictates the biological survival and coloration of flora and fauna. Historically, hobbyists relied on visually weighted metrics like lumens or basic wattage to estimate intensity. However, lumens peak at 555 nm—aligned with human visual sensitivity rather than plant photochemistry. Modern horticulture requires an empirical approach centered on aquarium par meter mapping. This rigorous protocol measures Photosynthetic Photon Flux Density (PPFD), expressed in µmol·m⁻²·s⁻¹, to quantify the exact micromoles of photons striking a one-square-meter area every second across the water column.
Understanding how to measure par in planted aquarium environments starts with recognizing that Photosynthetically Active Radiation (PAR) measures all photons from 400 to 700 nm with equal weight. Yet, biological utility depends strictly on photosynthetically usable radiation (PUR). A high-intensity fixture heavily weighted in green or yellow bands delivers misleadingly high PAR while offering poor metabolic returns. Evaluating pur efficiency vs par for aquatic plants requires balancing photon delivery directly against chlorophyll a and b absorption peaks in the blue (430–453 nm) and deep red (642–662 nm) spectrums.
Modern solid-state diode arrays make managing led spectrum photon distribution aquarium conditions fully customizable. However, light entering the water does not decay by a simple inverse-square law; fluid absorption causes severe light attenuation water depth loss governed by the Beer-Lambert Law. Accurate mapping therefore demands a calibrated quantum flux density sensor with underwater immersion correction to counter refractive error. By systematically mapping this 3D irradiance field, aquarists eliminate localized algae blooms, optimize anthocyanin expression, and align photon delivery with real botanical needs.
Interactive Aquarium PAR Mapping Matrix
Select your fixture type, log your measured PPFD readings across the depth grid, and export/print your custom photobiology map.
| Water Column Depth | Left Horizon | Center Core | Right Horizon |
|---|---|---|---|
| Upper Canopy (2–5 cm Sub-surface) | Target: 200–300 | Target: 250–350+ | Target: 200–300 |
| Mid-Water Plane (Mid Depth Column) | Target: 120–180 | Target: 150–250 | Target: 120–180 |
| Benthic Substrate (Aquasoil / Sand Bed) | Target: 40–80 | Target: 80–150 | Target: 40–80 |
Table of Contents
The Physics of Photosynthetic Light: PAR versus PUR
While Photosynthetically Active Radiation (PAR) quantifies all photons between 400 nm and 700 nm with equal mathematical weight, aquatic plants do not metabolize every wavelength with identical biological efficiency. This physiological discrepancy makes aquarium par meter mapping insufficient on its own without analyzing photosynthetically usable radiation (PUR). Evaluating pur efficiency vs par for aquatic plants is essential to determine true metabolic light availability rather than relying on raw photon output alone.
PAR treats all spectral energy uniformly: a green photon at 530 nm receives the exact same metric value as an energy-dense deep red photon at 660 nm. However, empirical photobiological research established by Dr. Keith J. McCree in 1972 demonstrated that the quantum yield of carbon fixation is strictly wavelength-dependent. The resulting McCree Curve identifies two primary photosynthetic efficiency peaks: a blue band centered at 440 nm and an elevated red peak spanning 620 nm to 680 nm. When measuring light over an aquascape, aligning diode spectrums with biological absorption curves yields superior growth compared to overwhelming the water column with unweighted irradiance.
Evaluating Spectral Quality: Quantum Yield vs. Aggregate Irradiance
Understanding the physiological mechanics of photosynthetic light quality prevents wasting electrical power on non-usable spectrums:
- Unweighted PAR Limitations: Fixtures emitting excessive yellow and green wavelengths often report high aggregate PAR numbers on quantum meters, but their functional PUR remains deficient because plant tissue largely reflects mid-band wavelengths.
- Accessory Pigment Stress: Forcing aquatic plants to process non-targeted spectrums expends metabolic reserves to dissipate unusable photon flux via non-photochemical quenching rather than driving rapid carbon fixation.
- High-PUR Energy Conservation: Fixtures optimized for targeted photosynthetic wavelengths deliver higher growth rates and intense coloration at significantly lower total PPFD thresholds.
- Canopy Penetration Mechanics: While blue and deep red photons drive the majority of surface chloroplast reactions, green spectrums penetrate deeper into lower mesophyll tissue and dense understory canopies where primary wavelengths cannot reach.
Balancing targeted blue and deep red spikes with full-spectrum fill ensures that high-light carpeting plants and heavily shaded submersed stems both receive optimal photon densities, which can be further refined by exploring shade-tolerant low light plants.
The Paradigm Shift to Extended PAR (ePAR): Classical PAR strictly measures 400–700 nm. However, recent photobiological breakthroughs by Dr. Bruce Bugbee (Utah State University) demonstrate that far-red photons (700–750 nm) drive canopy photosynthesis with equal efficiency when combined with shorter wavelengths (the Emerson enhancement effect). Modern fixtures utilize far-red diodes, requiring ePAR sensors (such as the Apogee SQ-610) to capture photons standard quantum meters ignore.
Photosynthetically Usable Radiation and Pigment Absorption Dynamics
To fully comprehend photosynthetically usable radiation, an aquarist must analyze the specific molecular receptors responsible for photon capture within the plant’s thylakoid membranes. While raw aquarium par meter mapping registers every photon between 400 nm and 700 nm, photochemical carbon fixation is driven primarily by Chlorophyll a, Chlorophyll b, and accessory carotenoids.
The chlorophyll a and b absorption peaks dictate the exact biological wavelengths required for cellular metabolism. Chlorophyll a acts as the principal electron donor in Photosystem I (P700) and Photosystem II (P680), whereas Chlorophyll b captures auxiliary resonance energy and funnels it into the photosynthetic reaction center.
| Pigment Molecule | Primary Peak (Blue Band) | Secondary Peak (Red Band) | Primary Photobiological Function |
|---|---|---|---|
| Chlorophyll a | 430 nm | 662 nm | Primary electron donor in Photosystem I and II reaction centers; drives baseline photochemistry. |
| Chlorophyll b | 453 nm | 642 nm | Accessory light harvester; expands absorption bandwidth and transfers energy directly to Chlorophyll a. |
| Carotenoids (β-carotene) | 400–500 nm | None (Reflects Orange/Red) | Photo-oxidative thermal dissipation (photoprotection) and secondary blue photon capture. |
| Peridinin / Neo-peridinin | 400–550 nm | None | Marine accessory pigment in symbiotic dinoflagellates; essential for reef coral zooxanthellae. |
Biochemical Adaptation and Pigment Telemetry
Understanding pigment dynamics explains why two light fixtures with identical substrate PAR numbers often yield dramatically different growth profiles:
- Dynamic Chl a:b Ratios: Under high irradiance, aquatic plants downregulate Chlorophyll b, raising the a:b ratio to prevent cellular excitation overload. In low-light environments, plants actively synthesize additional Chlorophyll b to scavenge scattered blue and green photons that penetrate deep shaded canopies.
- Carotenoid Photoprotection: When intense LED fixtures deliver photon flux exceeding the electron transport chain’s capacity, carotenoids convert the excess kinetic energy into harmless heat through non-photochemical quenching (NPQ), preventing fatal thylakoid bleaching.
- Spectrophotometric Quantification: Precise laboratory quantification of these pigment concentrations relies on the classical Arnon and Davis equations, measuring optical density extracts in 80% acetone at 663 nm, 645 nm, and 480 nm to verify metabolic health.
LED Spectrum Photon Distribution and Photosynthetic Efficacy
Optimizing led spectrum photon distribution aquarium setups requires understanding the physics of solid-state illumination beyond mere aesthetic color blending. Modern fixtures utilize discrete semiconductor diode arrays to emit narrow-band wavelengths tailored to plant photochemistry. Evaluating the electrical and quantum efficiency of these light sources requires moving past obsolete lumens-per-watt ratings to Photosynthetic Photon Efficacy (PPE).
PPE quantifies the total photosynthetic photon flux emitted per second relative to the input electrical wattage, expressed in µmol·J⁻¹. Governed by the Planck-Einstein relation and the Stark-Einstein law, the production of each photon requires the excitation of a single electron within the diode junction. Because long-wavelength red photons carry less energy than short-wavelength blue or UV photons, driving red diodes requires lower forward voltage. Consequently, deep red solid-state emitters achieve the highest PPE conversion ratings in modern horticulture.
Consequently, deep red solid-state emitters achieve the highest PPE conversion ratings in modern horticulture. To understand the deeper physiological mechanisms of light absorption and energy conversion, exploring peer-reviewed literature detailing the photosynthetic photon efficacy limits in modern LED technology provides invaluable photobiological context.
| Diode Type | Peak Wavelength | Typical Efficacy (µmol·J⁻¹) | Primary Botanical & Aquacultural Impact |
|---|---|---|---|
| Deep Red | 660 nm | 4.40–4.85 | Matches Chlorophyll a absorption; delivers highest PPE; drives biomass accumulation and carbon fixation. |
| Royal Blue | 450 nm | 3.00–3.50 | Stimulates Chlorophyll b; suppresses stem elongation for bushy growth; penetrates water columns deeply. |
| Cool White | 6500 K | 2.70–2.90 | Phosphor-converted blue emission providing broad-spectrum balance and elevated visual Color Rendering Index (CRI). |
| Far-Red | 730 nm | 4.00–4.70 | Drives phytochrome equilibrium; triggers shade-avoidance response; falls outside standard 400–700 nm PAR limits. |
Diode Selection and Photon Penetration Dynamics
Balancing discrete monochromatic diodes with broad phosphor arrays prevents structural growth defects while optimizing radiometric yield:
- PPE Optimization vs. Visual Ergonomics: Maximizing deep red diodes yields the highest electrical efficiency and raw PAR per watt, but causes severe color distortion and deactivates cryptochromes without supplemental blue spectra.
- Spectral Penetration Discrepancies: While 660 nm red photons drive rapid carbon capture at the surface, they attenuate rapidly in deep water columns, making 450 nm royal blue wavelengths crucial for bottom-dwelling plants and coral zooxanthellae.
- Balanced Full-Spectrum Design: High-tech WRGB fixtures blend targeted red and blue peaks with green and white fill diodes, achieving high biological PUR while maintaining a natural visual spectrum.
Light Attenuation, Depth Dynamics, and the Beer-Lambert Law
In an aquatic environment, radiant energy does not diminish purely according to the inverse-square law as it does through ambient air. Water serves as a dense, optically reactive medium where photons are rapidly scattered and selectively absorbed. Consequently, calculating light attenuation water depth gradients requires applying the Beer-Lambert Law to model the exponential decay of downward irradiance through the water column.
The mathematical decay of Photosynthetic Photon Flux Density (PPFD) is modeled by the classic exponential attenuation equation:
Beer-Lambert Law (Light Attenuation in Water)
E(z) = E(0) · e−Kd · z
Where:
- E(z): Downwelling irradiance (PAR) at depth z (µmol·m⁻²·s⁻¹)
- E(0): Sub-surface irradiance immediately below the air–water interface
- Kd: Diffuse vertical attenuation coefficient (m⁻¹)
- z: Water column depth (m)
Optical Absorption and Water Column Dynamics
Even in chemically pure water, different wavelengths attenuate at fundamentally unequal rates, dramatically altering the spectral profile before light reaches the substrate:
- Rapid Red-Band Extinction: Pure water absorbs infrared and red wavelengths with extreme speed; over 80% of 660 nm red light is converted to thermal energy within the first meter of depth. In tanks deeper than 50 cm, benthic plants receive a spectrum heavily depleted of red photons.
- Blue and Green Penetration: Shorter wavelengths in the 430–500 nm range penetrate deepest through pristine freshwater and reef columns, making high blue fractions vital for deep-water carpet plants and benthic zooxanthellae.
- Impact of Dissolved Organics (CDOM): Introducing botanical tannins and humic compounds contributes to Chromophoric Dissolved Organic Matter (CDOM), which aggressively absorbs blue and ultraviolet wavelengths, raising Kd and artificially tinting the transmitted light toward yellow and red bands.
- Particulate Turbidity Scattering: Suspended organic detritus, microscopic algae, and micro-bubbles cause Mie and Rayleigh scattering, reflecting photons outward and reducing the forward-propagating flux density toward the substrate.
Due to dynamic variations in Kd caused by surface agitation and organic load, theoretical wattage formulas and dry-air manufacturer PAR maps fail. Direct, in-situ submersed measurements are mandatory to establish true biological irradiance.
Quantum Flux Density Sensor Mechanics and Metrology
Capturing exact PPFD levels underwater requires a laboratory-grade quantum flux density sensor engineered specifically for aquatic metrology. Unlike standard photographic lux meters or basic smartphone ambient light sensors, a true quantum sensor utilizes blue-enhanced silicon photodiodes combined with precision optical bandpass filters. This design ensures every incoming photon across the 400–700 nm photosynthetic waveband is counted equally, regardless of its discrete energy level.
Deploying these sensitive radiometric instruments beneath the water’s surface introduces severe optical physics challenges that must be corrected directly through specialized calibration and physical design.
The Immersion Effect and Refractive Index Correction
When an optical diffuser transitions from air into a fluid medium, its light-capturing behavior changes fundamentally due to refractive index disparities:
- Refractive Index Shift: The refractive index of ambient air is approximately 1.00, whereas freshwater measures 1.33 and saltwater approaches 1.34.
- Diffuser Backscattering: Because light moves from a denser optical medium (water) into the acrylic or Teflon diffuser of the sensor, a larger proportion of downwelling photons are internally backscattered and reflected away from the internal silicon photodiode detector.
- Uncorrected Measurement Deficit: Submersing an air-calibrated quantum meter without firmware adjustment causes an artificial reading drop of 15% to 25% below actual biological irradiance.
- Sub-Aquatic Firmware Correction: Specialized instruments, such as the Apogee MQ-510, feature factory-calibrated internal multipliers (typically 1.25 for modern full-spectrum sensors or 1.15 for older sensors) that instantly restore true volumetric photon values in underwater mode.
For researchers and serious hobbyists seeking laboratory-grade radiometric accuracy, investing in an immersion-corrected quantum sensor is the universally accepted industry standard for underwater light metrology.
To achieve absolute accuracy, an Immersion Effect Correction Factor (IECF) must be applied. The correction formula is mathematically straightforward but critical for success: true corrected PAR equals the raw meter reading multiplied by the specific IECF. The specific multiplier is highly dependent on the optical geometry of the individual sensor model:
| Sensor Manufacturer & Model | Calibration Environment | Immersion Effect Correction Factor (Multiplier) |
|---|---|---|
| Apogee Original Quantum (SQ-120 / MQ-200) | Air Calibrated | ×1.32 (or ×1.25 on newest iterations) |
| Apogee Full Spectrum (SQ-500 / MQ-500) | Air Calibrated | ×1.25 |
| Apogee ePAR Sensor (SQ-610) | Air Calibrated | ×1.35 |
| Budget Meters (DanoPlus / VBR Aqua) | Air Calibrated | ×1.35 |
| Apogee Underwater Quantum (MQ-510) | Factory Firmware Corrected | 1.00 (No manual correction needed) |
| Seneye Reef PAR Meter | Native Water Optical Path | 1.00 (No manual correction needed) |
Note: When using an air-calibrated budget meter (such as DanoPlus retailing around $129), users must manually apply the 1.35 multiplier to raw readings to align with professional benchmarks, though these units may still exhibit spectral bias on extreme violet and UV ends.
Cosine Response and Directional Error Mitigation
Photons traversing an aquarium rarely strike the sensor at a flat 90-degree perpendicular angle. Wide-angle LED secondary lenses (such as 90° or 120° optics), surface rippling, and reflections off glass walls cause photons to arrive at extreme, oblique angles.
A precision quantum sensor incorporates a domed, raised optical diffuser specifically engineered to provide an accurate cosine response. This allows the detector to weigh oblique light intensity proportionally to the cosine of its angle of incidence, maintaining measurement error margins below ±5% even at severe 75-degree zenith angles.
Protocol: How to Measure PAR in Planted Aquarium
Executing an accurate light telemetry protocol requires a strict, repeatable framework. Simply dropping a sensor directly below the center of the LED fixture produces an incomplete, misleading dataset. The goal of learning how to measure par in planted aquarium systems is to map the entire 3D volumetric space, ensuring both low light aquarium plants and photon-demanding species sit within their exact physiological thresholds.
Step-by-Step Measurement Framework
- Step 1: Environmental Baseline and Water Clarity: Clean both sides of the aquarium glass, clear away floating plant debris, and ensure filter surface agitation matches daily operational levels. Surface agitation forms dynamic caustic lenses that focus and disperse light rays, inducing rapid photon flux spikes.
- Step 2: Sensor Stabilization and Averaging: Mount the waterproof quantum sensor head to a rigid wand (such as an Apogee AM-310) while keeping the main display unit dry. Because caustic ripple patterns cause the digital PPFD values to jump rapidly, set the meter to log a 30-second running average, or visually record the median value between high and low swings.
- Step 3: Vertical Horizon Profiling: Measure downwelling irradiance along the center vertical line at three distinct planes: 2 cm beneath the surface interface, the exact mid-water column, and directly resting on the benthic substrate. This establishes the unique vertical light attenuation slope (Kd) for your specific water clarity.
- Step 4: Horizontal Falloff Grid: Secondary LED lenses (such as 60° narrow beams or 120° wide optics) generate sharp lateral light decay. Move the sensor from the center point outward toward the front glass, back panel, and tank corners to identify low-light peripheral zones.
Accounting for fixture form factor is vital: Panel LEDs (Chihiros WRGB2, Ecotech Radion Gen 6) deliver wide, uniform coverage across the footprint, requiring fewer measurement points. Conversely, Point-Source Pucks (Kessil A360X, AquaIllumination Prime 16HD) create intense central hotspots with rapid peripheral drop-offs, requiring dense edge-grid mapping to prevent shaded dead-zones.
The application of light must be deliberate and stratified. The mapping of an aquarium is useless if the aquarist does not know the specific saturation thresholds of their livestock. The following data outlines the safe operational PAR boundaries for various photosynthetic organisms, minimizing the risk of chronic photoinhibition while maximizing growth and coloration:
| Organism / Classification | Min PAR (μmol·m²·s¹) | Optimal PAR (μmol·m²·s¹) | Photoinhibition Risk Level |
|---|---|---|---|
| Soft Corals Mushrooms, Zoanthids, Leathers | 50 | 75–150 | Low to Moderate |
| LPS Corals Euphyllia, Micromussa, Trachyphyllia | 150 | 150–250 | Moderate |
| SPS Corals Acropora, Montipora, Stylophora | 250 | 250–350+ | High (if > 400) |
| Tridacna Clams Maxima, Crocea | 100 | 200–300 | Low |
| Planted Tank Carpets Monte Carlo, HC Cuba | 80 | 100–150 | High (Algae Risk) |
These targets must be paired with an appropriate aquarium lighting photoperiod, typically a 1-8-1 schedule (one hour ramp-up, eight hours steady intensity, one hour ramp-down) to support natural zooxanthellae rhythms and avoid exhausting the Xanthophyll cycle.
Structural Element Strategic Data Assignment and 3D Matrix Mapping
Planar 2D measurements fail to capture the complex lighting environments found in modern aquascapes. Intricate hardscapes composed of towering Seiryu stone, Dragon stone, or branching Spiderwood introduce pronounced topographical variations and microclimates. To achieve true telemetry control, aquarists must replace basic flat-surface checks with a volumetric 3D spatial matrix that accounts for structural shading and light occlusion.
Executing Structural Element Strategic Data Assignment requires recording radiometric values after the hardscape is permanently secured and the tank flooded, but prior to planting:
- Spatial Matrix Grid Division: Divide the tank’s horizontal footprint into a uniform 10 × 10 cm coordinate grid along the X and Y axes.
- Topographical Z-Axis Profiling: Lower the sensor head into every grid coordinate until it meets either the aquasoil substrate or a hardscape surface. Log the PPFD reading alongside its exact physical height coordinate.
- Shadow Occlusion Plotting: Hardscape overhangs, caves, and leeward rock surfaces create steep light falloffs. A high-light rock terrace receiving 150 µmol·m⁻²·s⁻¹ can plummet to 20 µmol·m⁻²·s⁻¹ just a few centimeters away beneath an overhang due to physical photon blockage.
- Programmatic Botanical Placement: Use the completed 3D telemetry map to position flora according to their biological thresholds. Fast-growing, high-demand carpeting species like Glossostigma elatinoides belong exclusively in unoccluded zones exceeding 100 µmol·m⁻²·s⁻¹. Conversely, shade-obligate epiphytes detailed in our Anubias care and lighting guide should be anchored directly into hardscape pockets restricted to 30–45 µmol·m⁻²·s⁻¹.
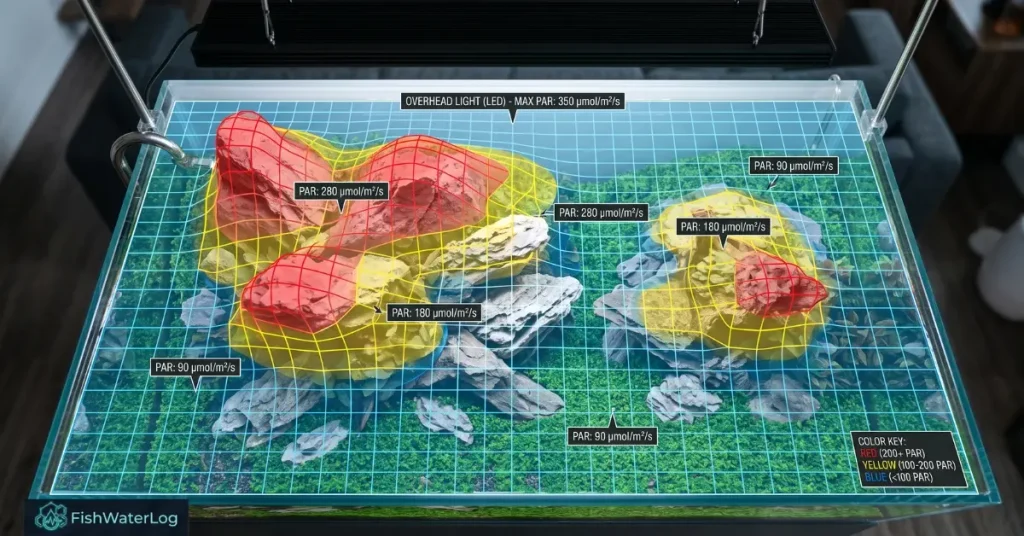
Mapping the tank’s 3D matrix eliminates localized algae outbreaks—often managed alongside a calibrated aquarium CO2 drop checker—caused by placing low-energy plants in high-PAR zones and stops lower-stem rot caused by inadequate lighting under shaded hardscape features. To ensure your demanding aquatic flora have the nutrient foundation necessary to utilize high PAR lighting efficiently, review our comprehensive analysis on aqua soil and substrate requirements.
Photobiomodulation and Phytochrome Photoequilibrium
Beyond supplying raw energy for carbon fixation, the specific spectral composition of an LED fixture actively directs plant morphology and architecture through photobiomodulation. Aquatic macrophytes monitor their ambient light environment using non-photosynthetic sensory photoreceptors—primarily cryptochromes (which process blue and UVA light to direct phototropism and leaf expansion) and phytochromes (which govern developmental responses to red and far-red wavelengths).
The phytochrome system operates as a molecular light switch, converting reversibly between two conformational isomers: a physiologically inactive, red-absorbing state (Pr, with an absorption peak at 660 nm) and an active, far-red-absorbing state (Pfr, with an absorption peak at 730 nm). The ratio of active phytochrome to total phytochrome defines the Phytochrome Photoequilibrium (PPE), or photostationary state (PSS).
Spectral Manipulation and Morphological Regulation
Controlling the spectral balance allows aquarists to fine-tune plant growth forms and avoid common structural flaws:
- Shade Avoidance Mechanics: In dense aquatic stands, upper leaf layers absorb 660 nm red photons for photosynthesis while transmitting 730 nm far-red light downward. The resulting low Red to Far-Red (R:FR) ratio shifts phytochromes into the inactive Pr state, triggering shade avoidance: stems rapidly elongate their internodes, leaves become thin, and lateral branching halts.
- Suppressing Leggy Growth: Tunable WRGB arrays allow aquarists to flood the aquarium with intense 660 nm deep red and 450 nm royal blue wavelengths while eliminating far-red emissions. This maintains a high PSS, signaling to the plants that they sit in unshaded light, which promotes compact internodes and dense, bushy side branching.
- Anthocyanin Expression: Combining high blue photon flux with strong deep red irradiance stimulates cryptochromes, prompting plants to upregulate protective anthocyanin pigments. This cellular defense mechanism creates the intense, deep red and magenta coloration seen in high-light species like Rotala macrandra and Ludwigia varieties.
Advanced Telemetry Overlooked in Mainstream Aquascaping
Mainstream aquascaping and reef-keeping literature frequently oversimplifies aquatic photobiology, resulting in systemic lighting mismanagement across the hobby. Evaluating current online guides against empirical metrology reveals three critical analytical deficiencies:
- Oversimplified Linear Water Columns: Popular resources often rely on obsolete “watts-per-gallon” guidelines or prescribe generic fixture power percentages based entirely on tank height. These linear approximations fail to account for the exponential decay defined by the Beer-Lambert Law. The diffuse attenuation coefficient (Kd) is highly variable between systems, driven dynamically by surface turbulence, dissolved organic matter (CDOM from driftwood tannins), and particulate turbidity. Consequently, dry-air manufacturer PAR graphs drastically overestimate benthic photon availability.
- Metrological Failure of Smartphone Light Meters: Budget-focused tutorials frequently recommend using smartphone sensor applications as low-cost PAR meters. However, smartphone CMOS detectors lack the raised, domed optical diffusers necessary for accurate cosine response corrections at oblique angles. Furthermore, enclosing a phone in a plastic sleeve to take submersed readings distorts refractive indices and completely bypasses the essential 1.33 fluid immersion effect calibration, yielding erratic and misleading 3D mapping data.
- Conflation of Raw PAR with PUR Quality: Mainstream setup advice routinely prescribes blanket PAR targets (such as reaching 100 µmol·m⁻²·s⁻¹ at the substrate) while ignoring spectral quality. A standard 6500K commercial cool-white LED emitting broad green-yellow peaks can produce identical quantum meter numbers to a tailored WRGB fixture. However, the cool-white source lacks the concentrated blue and deep red spikes required to saturate chlorophyll absorption peaks and manipulate phytochrome photoequilibrium, yielding weak internodal compaction and muted red coloration.
Addressing these technical oversights shifts aquarium lighting management from basic visual estimation to predictable, laboratory-grade telemetry.
Practical Implementation: Rent vs. Buy and Measurement Variables The primary barrier to entry for PAR mapping is the prohibitive cost of professional-grade equipment, with units like the Apogee MQ-510 retailing for over $500. For casual hobbyists, a highly practical alternative is to rent a professional meter from Local Fish Stores (LFS), regional reefing clubs, or community Facebook groups for a nominal fee of $40 to $60 per week.
When conducting the physical mapping with these rented tools, aquarists frequently debate the “Flow-On vs. Flow-Off” method. Because active water surface movement causes rapid refractive fluctuations, you must either temporarily disable all water flow to establish a flat baseline reading, or maintain standard flow and mathematically average a multi-second reading to accurately represent the chaotic light environment the organisms experience daily.
Conclusion
Cultivating a resilient high-tech planted aquarium or reef biotope requires transitioning from visual guesswork to precise, data-driven photobiological telemetry. By executing systematic aquarium par meter mapping, aquarists can measure real photon delivery rather than relying on misleading lux or wattage metrics. Integrating the critical differences between PAR and photosynthetically usable radiation (PUR) ensures light is delivered where aquatic plants can actively metabolize it—aligning photon flux with targeted chlorophyll a and b absorption peaks.
Accounting for the physics of exponential light attenuation via the Beer-Lambert Law, deploying immersion-corrected quantum sensors, and profiling topographical hardscape shading via 3D matrix mapping removes the trial-and-error cycle. Ultimately, controlling the spectral balance and photon density allows aquarists to manipulate phytochrome photoequilibrium, suppress internodal elongation, and unlock vivid anthocyanin pigmentation without risking localized algae proliferation. If you are balancing high-tech lighting telemetry with sensitive invertebrate livestock, maintaining pristine water chemistry is absolutely vital; learn more in our detailed diagnostic guide on Neocaridina water parameters and molting.
Frequently Asked Questions
What is the fundamental difference between PAR and PUR in an aquarium?
PAR (Photosynthetically Active Radiation) quantifies the total volume of photons between 400 nm and 700 nm, treating every wavelength equally. PUR (Photosynthetically Usable Radiation) assesses biological utility, measuring how effectively a plant’s pigment complexes (primarily Chlorophyll a and b) absorb and convert those wavelengths into chemical energy.
How do I measure PAR accurately in a planted tank?
Accurate measurement requires an underwater quantum flux density sensor with factory firmware calibration for the fluid immersion effect (compensating for the 1.33 refractive index of water). Take averaged readings across the surface, mid-water, and substrate, mapping both open areas and hardscape micro-shadows.
Why do red aquatic plants require higher PAR and specialized spectral output?
Red macrophytes synthesize protective anthocyanin pigments under high photon flux to shield cellular structures. Driving this coloration requires elevated PPFD (typically 100–200+ µmol·m⁻²·s⁻¹) paired with concentrated blue (450 nm) and deep red (660 nm) wavelengths, which also optimizes the phytochrome ratio to avoid leggy growth.
Does water depth significantly change the light spectrum hitting the substrate?
Yes. Due to the Beer-Lambert Law, water absorbs long-wavelength red photons exponentially faster than blue or green light. In aquariums deeper than 50 cm, over 80% of deep red irradiance attenuates before reaching the bottom, leaving the substrate bathed primarily in blue and green wavelengths.
Can a smartphone app replace a dedicated quantum flux density sensor?
No. Smartphone CMOS sensors lack cosine-correcting domed diffusers needed to accurately capture oblique light rays. Furthermore, sealing a phone inside a waterproof sleeve alters optical refraction and bypasses required immersion effect corrections, causing distorted readings that can trigger algae blooms or plant starvation.
